


1
2
3
4
5
6
7
8
Scatterplot of PM10-2.5 concentrations at an urban site in Denver (CCRUSH Study)
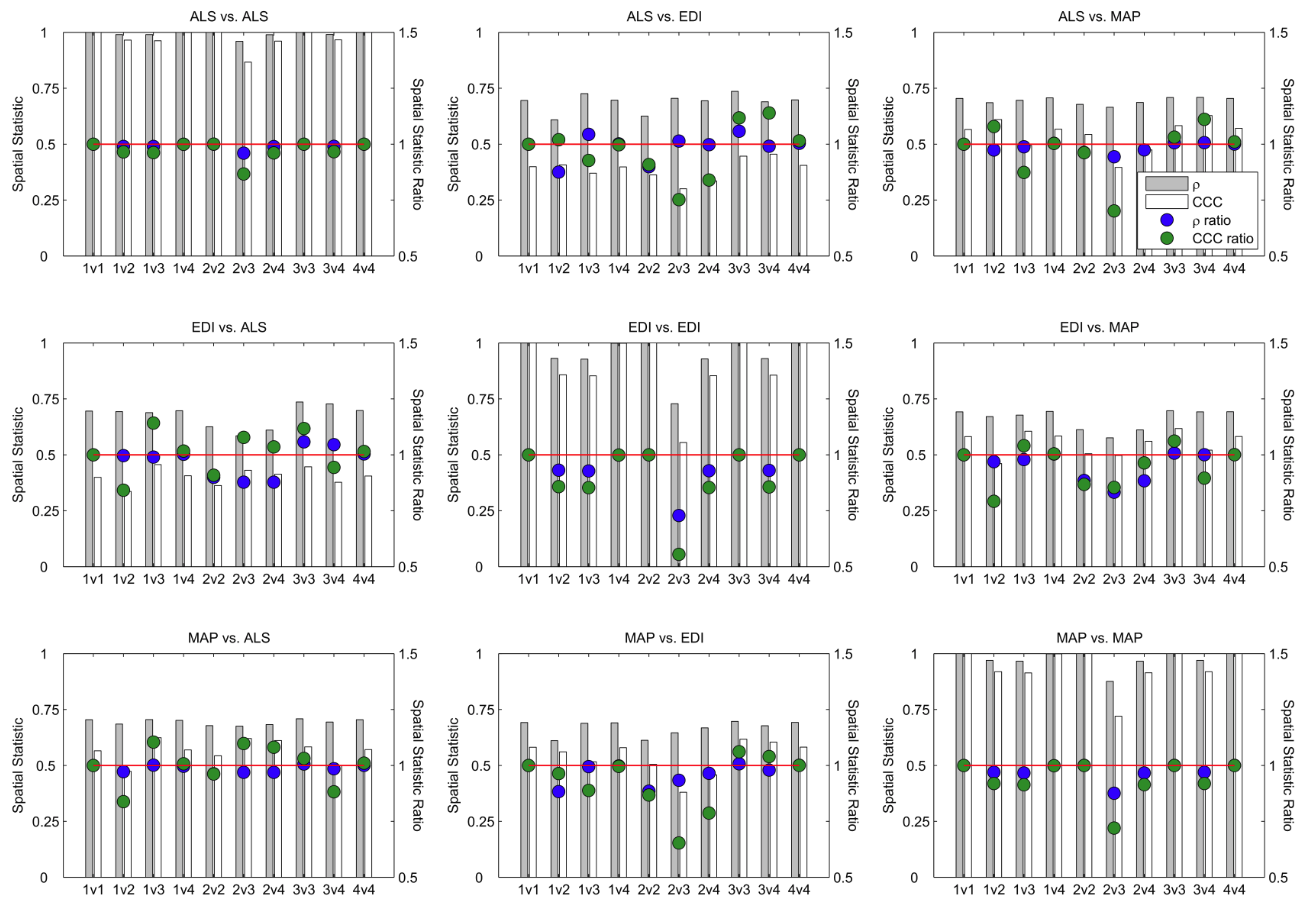
Effect of PM10-2.5 concentration estimation errors on spatial statistics for three sites in Denver (CCRUSH Study)
ECAD Pressure Monitoring
Organic Peak Fraction Concentrations (BEACHON-RoMBAS Campaign)
Benchmark CPU scores over different generations (Data Source: https://www.cpubenchmark.net/)